Digital Blood Pressure Monitor
Explore the design, development, and implementation of an integrated blood pressure cuff system, showcasing engineering rigor and persistence.
Integrated Design Project
The blood pressure cuff started off as my sophomore year integrated design project. This course involves the design, implementation, testing, and validation of hardware and software solutions to open-ended engineering problems, integrating both analog and digital components.
While by the end of the semester I had a rough working prototype  I was interested in still continuing development on the project further, further improving
portability, function, aesthetic and anything else I didnt have time to work on during the
semester.
I was interested in still continuing development on the project further, further improving
portability, function, aesthetic and anything else I didnt have time to work on during the
semester.
Basic Design
I'll try to keep things brief so as not to bore the readers while still remaining descriptive, as I do want this to be helpful for anyone who may want to recreate something similar.
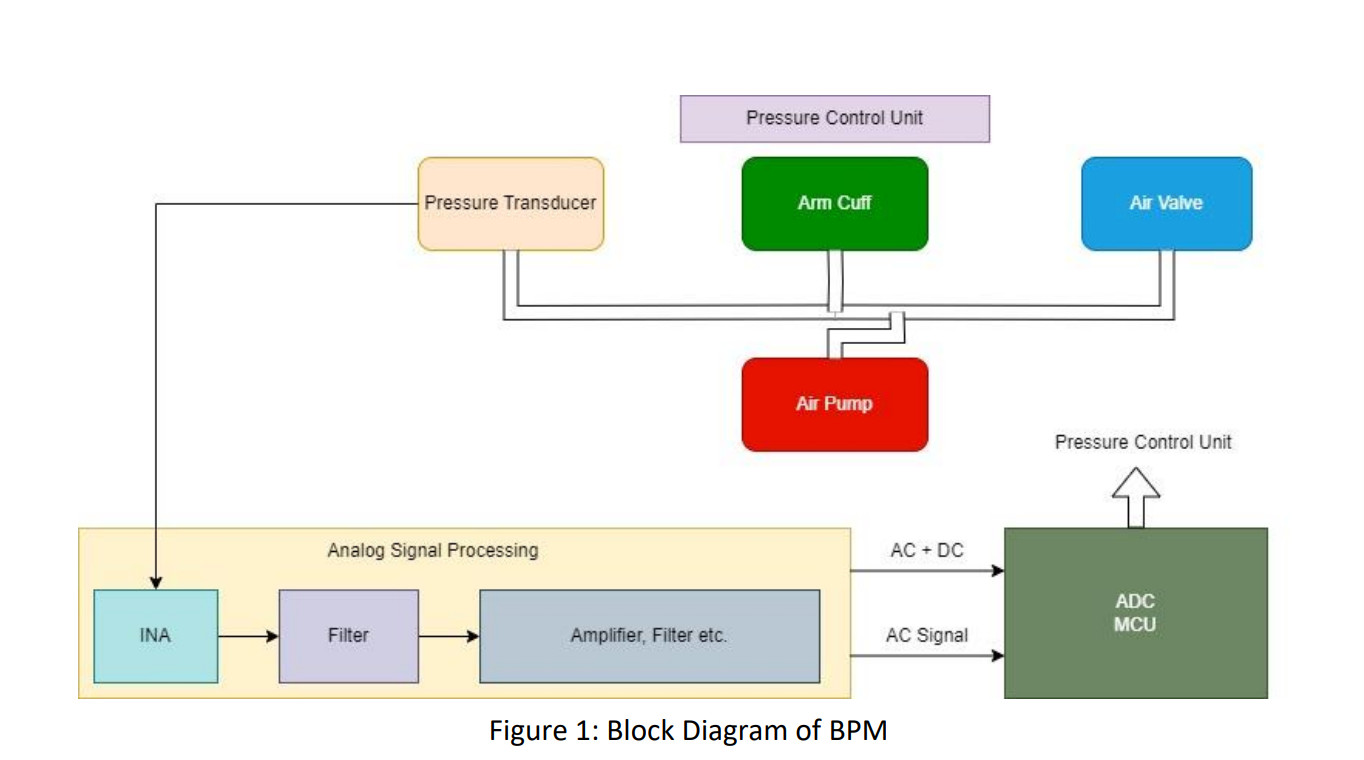
The first part of the project is gaining an understanding of the pressure system. There’s an arm cuff that you would recognize from the doctor’s office, a (NO) air valve, and a pressure transducer. The transducer converts the pressure from your arm into voltage readings that you will use an Arduino to process during a later milestone.
You then need to use an instrumentation amplifier to amplify that voltage reading since the transducer produces a very small output, not easily workable with the amount of precision an Arduino offers.
You then have to design a filter to remove the 60 Hz power hum from the wall outlet to make sure you’re only looking at the blood pressure signal and nothing else. This is also why you only measure blood pressure as the cuff is deflating and not while it’s inflating since the pump also produces noise of its own.
We didn’t need to design a filter for our take on the project, but if the filter caused too much attenuation of your blood pressure signal, you would then need to amplify your signal again to tie it back to 0-4 volts.
Finally, you get to write your algorithm for outputting your blood pressure readings and heart rate values.
I'll now move on to describe some of the main engineering challenges of the project.
60 Hz Power Noise Filtering
This was admittedly a tricky part of the project. I found out afterward that this is a widespread circuit, and I could have easily found references online instead of designing the entire filter from scratch.
The course recommends Analog Filter Wizard, and given that I’d never designed an analog filter before, I opted to follow their advice. I inputted a steep roll-off, since a healthy human heartbeat has a very low frequency compared to the noise from the wall that I was trying to filter out (0.5-1.5 Hz vs. 60 Hz).
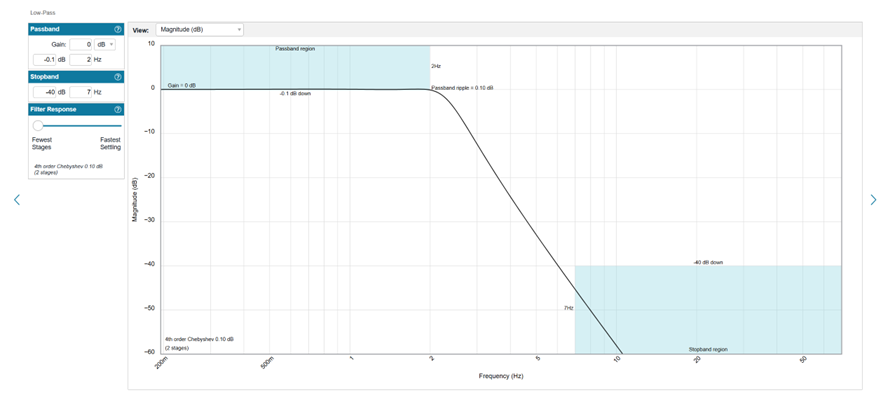
There are many solutions for this part of the project. I think a far better approach would be using a single-stage notch filter to target the 60 Hz hum, but I was working with time constraints, so I just opted for the quickest circuit I could get with Analog Filter Wizard.

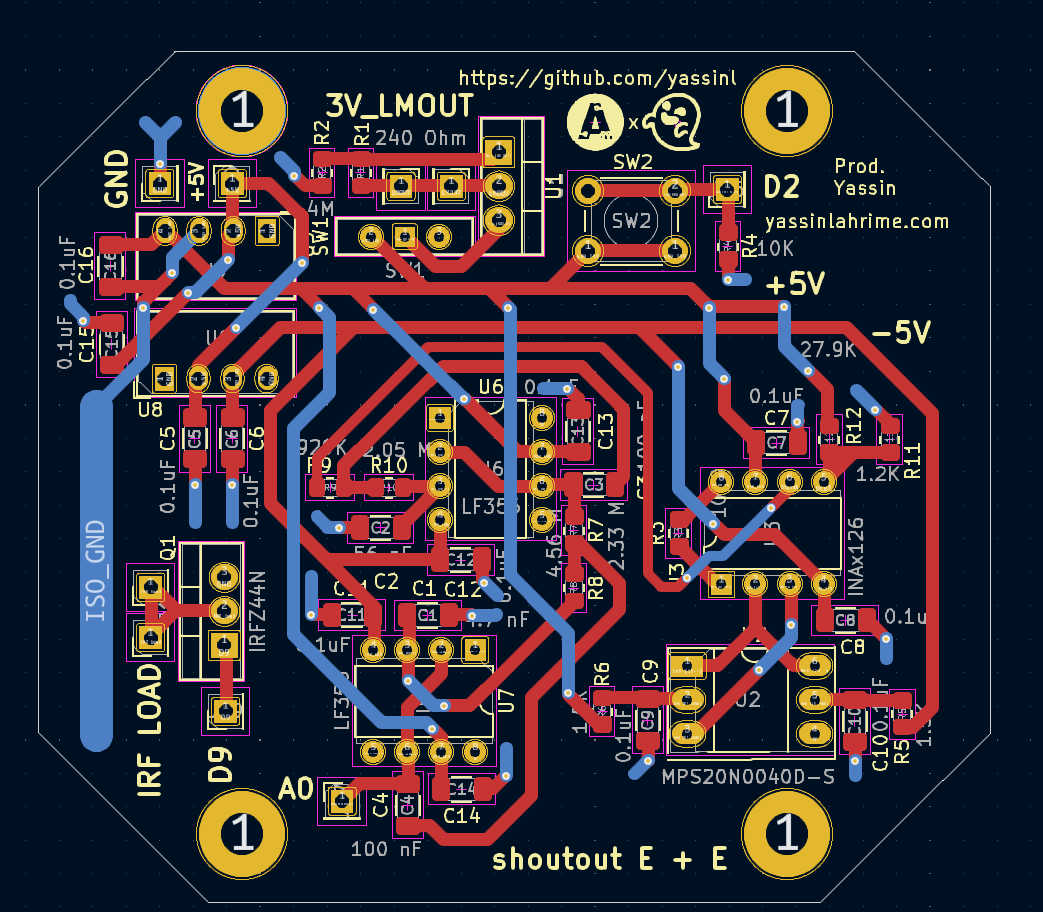
LM317 Power Circuit
This circuit was somewhat of a pain because it acted as the only form of voltage regulation in the entire system. While it is nice to ensuring you don’t fry the components, it has an issue with not providing enough power to the components after the IRFZ44N transistor is added to the mix. The transistor adds extra losses to the system, meaning the pump can no longer output as much power. We took a brute force solution to this by just railing the LM317 as hard as we possibly could by adding a 4M resistor onto the circuit. The original 3V output of the LM317 was moved up to 4.2V, and that solved most of the issues we were having with our pump not outputting enough pressure to the system.
Gain Calibration
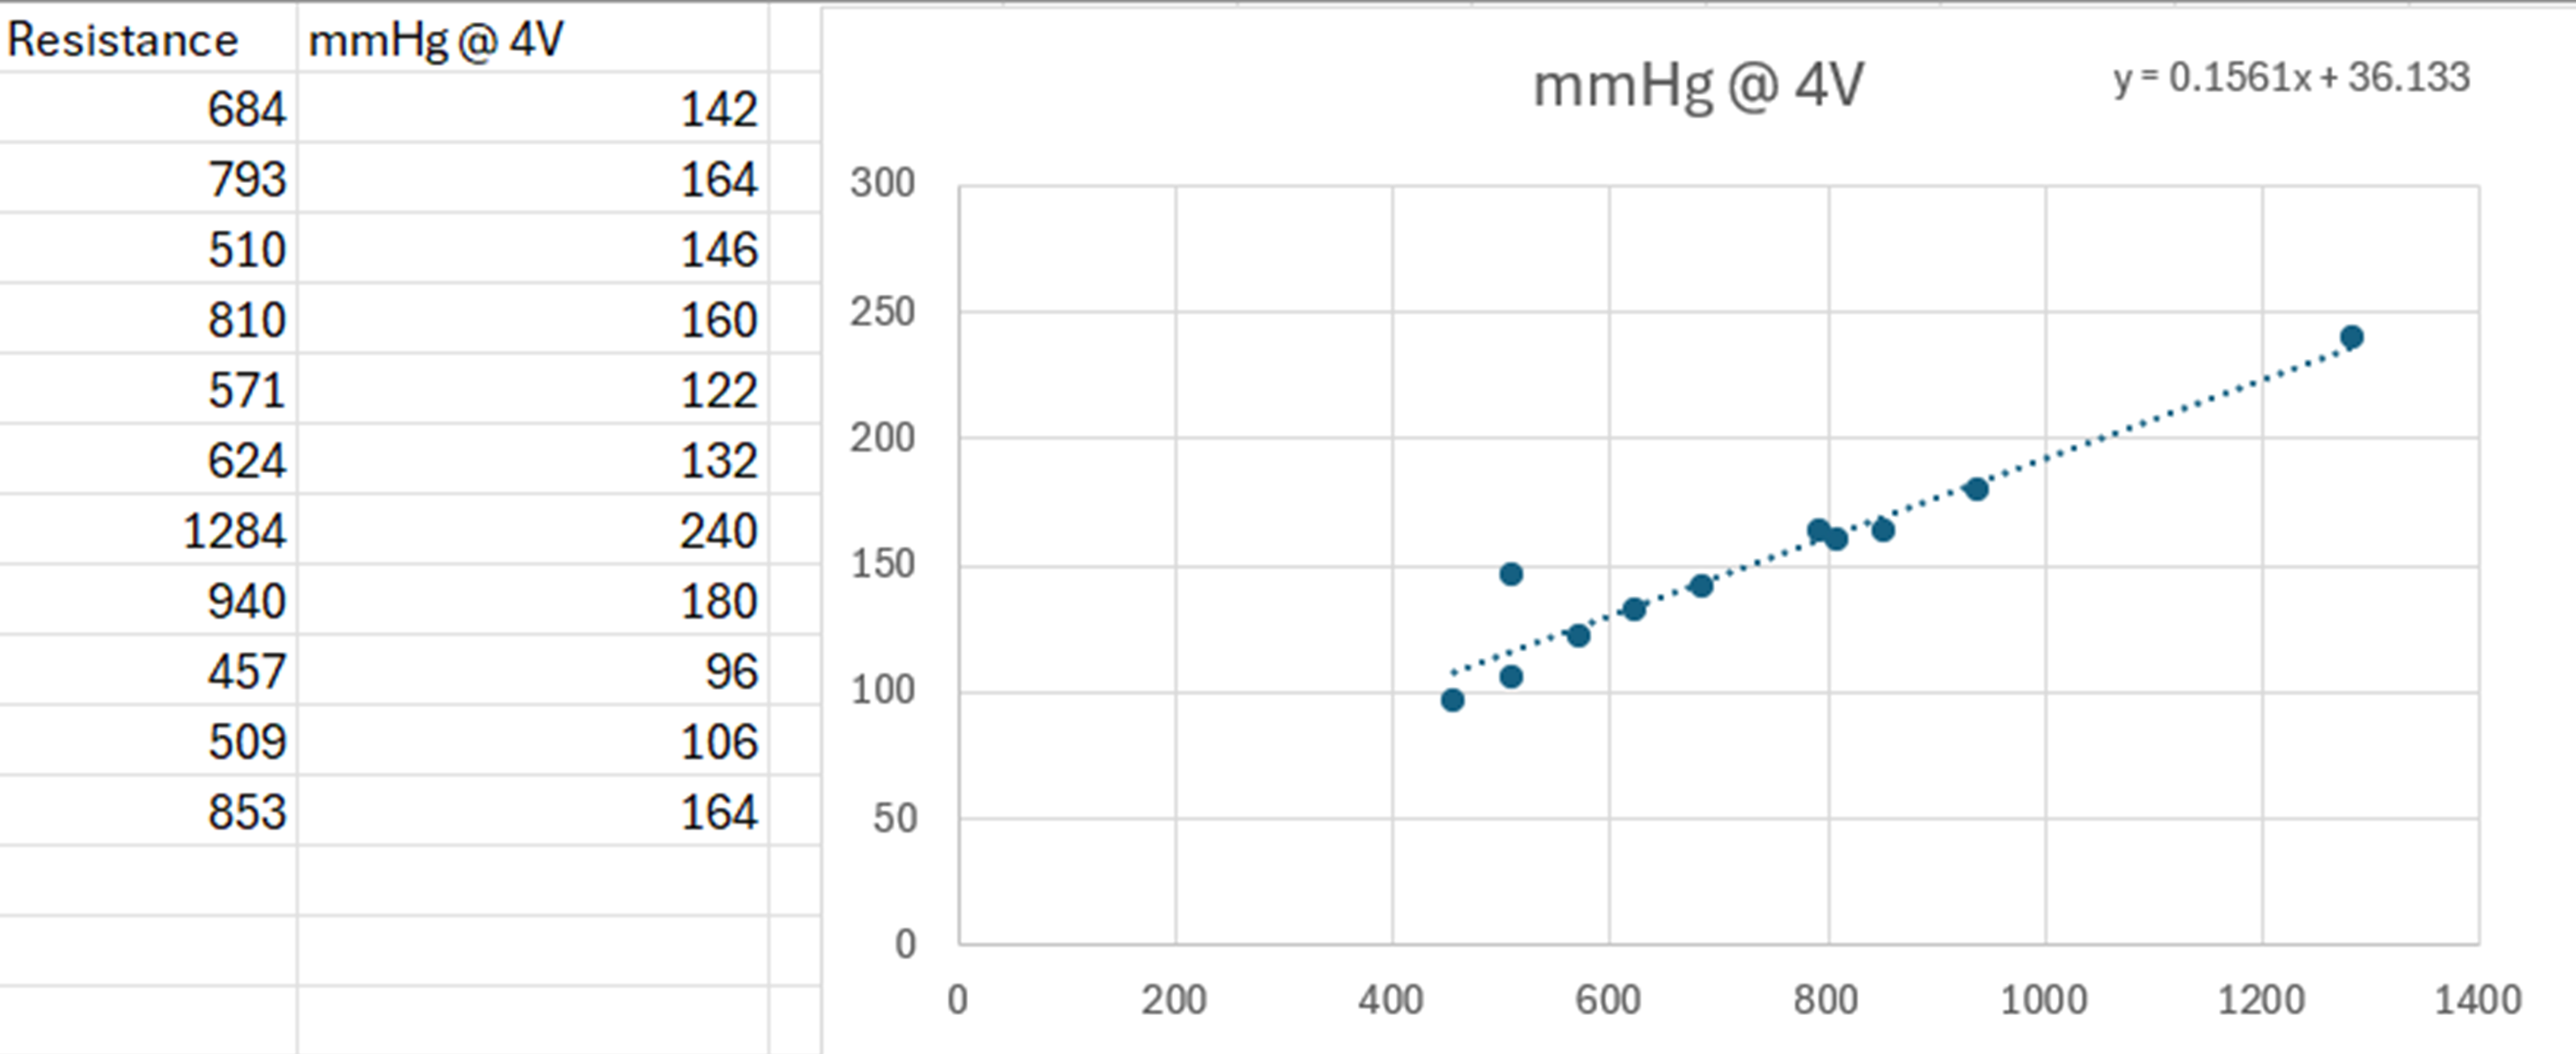
An important deliverable for the project was making sure that the voltage output of the INAx126 instrumentation amplifier stayed within 0-4V. This was both to ensure the algorithm developed later could deliver reliable results (within 4% accuracy) and to prevent the Arduino pin from being damaged by negative voltage.
To calibrate the gain, we performed a simple regression to tie the resistor value for our instrumentation amplifier to the pressure reading we got when our scope hit 4 volts. This was one of the more tedious parts of the project, but it was vital for ensuring accurate results in the end.
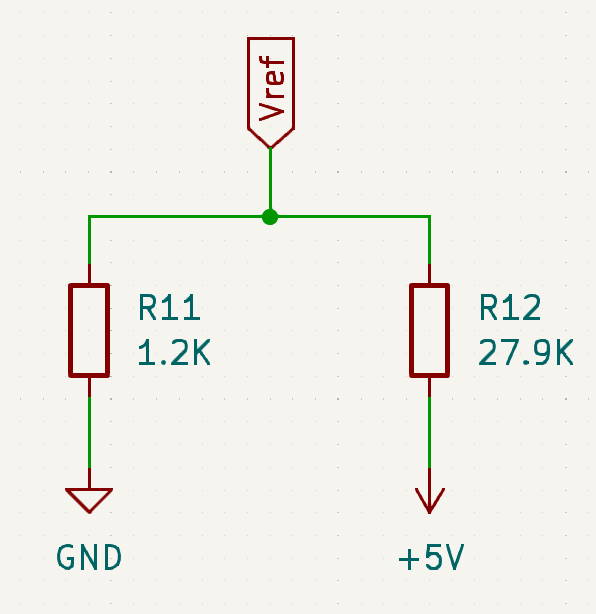
Negative Voltage
An extension of the last part is that, unfortunately, at low blood pressure values, the amplifier outputs negative voltage. Anyone who's worked with microcontrollers knows that they don't appreciate negative values.
There are many solutions to this issue, including a diode tied from output to ground, a level shifter, and a clamper circuit. But the solution that gave me the least issues—and that I was able to deploy the quickest, given our time constraints—was a simple voltage divider. The negative value never went past -0.20 volts in our testing, so I set up a reference voltage of 0.22 volts on the instrumentation to shift the signal up and then adjusted the values in the algorithm afterward.
This was a lifesaver during the last couple of days of our project.
Pressure Leakage
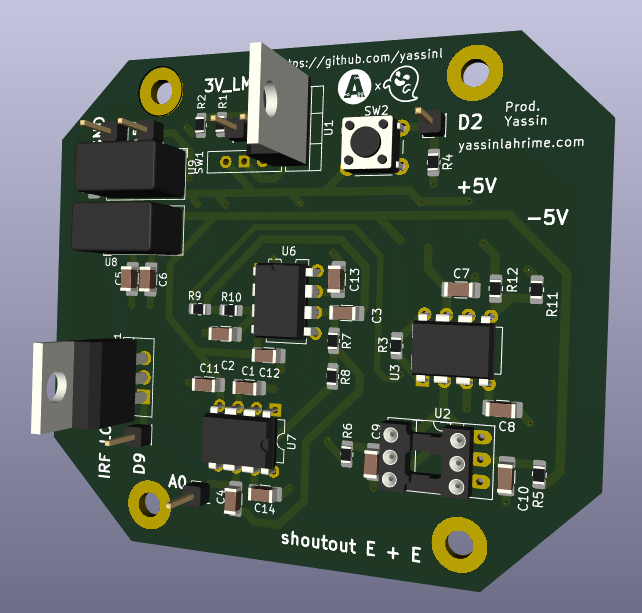
One issue we had throughout the project was that our pump was constantly weak, and our parts kept breaking. After the semester ended, I got the chance to design a 3D-printed enclosure and PCB for the circuit to properly secure the pressure system, but there was plenty of stress with hoses coming loose and failed calibration of the entire system. A friend even suggested putting Vaseline on the hoses to prevent pressure leakage, and that was what saved us during our final milestone deadline, allowing us to have a working project within the last couple of days.
Algorithmic Design
To get the blood pressure cuff to detect changes in heart rate and return stable values, I had to design a peak detection algorithm to run on the Arduino. Luckily, the algorithm is quite simple because a lot of filtering and smoothing was already done to prevent noise in the main circuit beforehand, so post-processing was kept to a minimum.
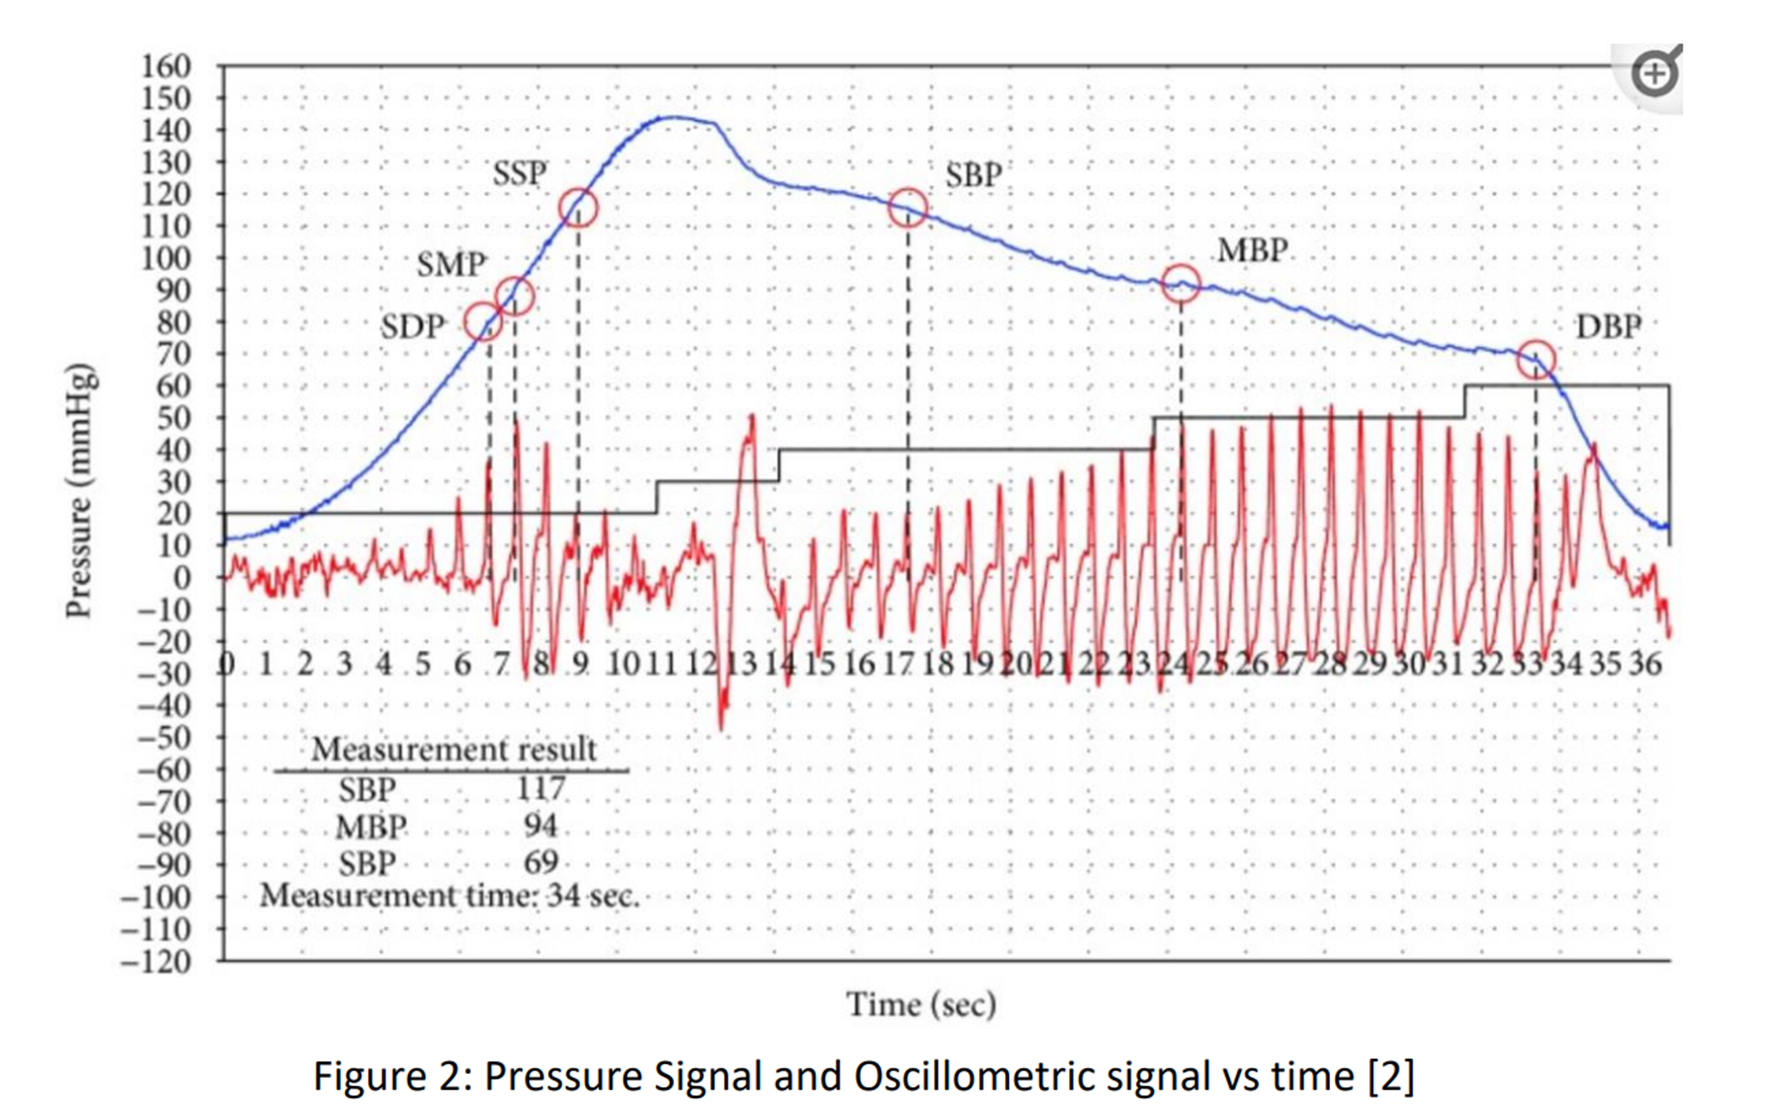
For the main blood pressure portion, we had to perform a lot of calibration to ensure pressure leaked at roughly a rate of 5 mmHg per second. This allowed us to select the Diastolic and Systolic pressure values from the curve as they were measured from the patient’s arm. From those two values, we solve for the mean arterial pressure with a simple equation.
Conclusion
This was a very exciting project for me because I was finally able to bridge my theoretical understanding of engineering into a practical sense.
With time constraints during the semester I didn't have all the time I wanted to add everything I wanted to the project. The class only required a basic breadboard prototype so the majority of what you see on this project was completed after the semester ended.
This project is still in progress so check back later for updates :D